Stop Guessing.
Start Following High-Accuracy Stock Signals.
Our Quant Agent tests 13 proprietary strategies across 348+ tickers — including US stocks, ETFs, and top cryptocurrencies (BTC, ETH, SOL) — and selects only the highest Win-Rate survivors, validated on unseen data to prevent curve-fitting. Simple BUY and SELL signals. No confusion.
- Trade Like a Quant
- Cancel Anytime
- Anti-Curve-Fit Verified
Methodology: Next-day open execution (no look-ahead bias) · 1.2% round-trip cost (commission + slippage) already deducted · Mark-to-market daily valuation. See Transparency below for full details.
Most signal services are curve-fit theatre.
We engineer for the opposite.
The Problem
Curve-fit backtests that look perfect
Most bots are tuned to historical data with dozens of parameters. They show 95% win rates in backtests — then collapse the moment they touch live markets.
5 conflicting indicators at once
RSI says oversold, MACD says bearish, the 200-MA says hold. You end up frozen — or worse, second-guessing every entry.
Confusing stop-losses & whipsaws
Tight stops get hunted on volatility. Wide stops blow through risk limits. Either way, you bleed fees and give back gains.
Our Solution
Out-of-Sample validated
Every strategy is optimized on In-Sample data, then tested on unseen Out-of-Sample data. If Win Rate drops >15% or PF falls below 1.5, it's discarded as curve-fit.
Dead-simple BUY / SELL
One signal per stock per day. No 5-indicator salad. You enter on BUY, you exit on SELL — that's the entire workflow.
Hold until the signal changes
Swing and position holds, tuned for highest Win Rate over the full trade. No intra-trade stops to get hunted. No whipsaw noise.
From scanner to signal to ledger — in three steps.
No 200-page manual. No 14-indicator dashboard. Just a clean, repeatable workflow engineered for clarity and conviction.
- Step 01
Choose your stocks
Pick from US stocks, ETFs, and cryptocurrencies via our high-accuracy scanner. Filter by sector, OOS Win Rate, Profit Factor, or current signal — and see exactly which strategies survived validation.
- Step 02
Get the signal
A single, clear BUY or SELL — selected by the Quant Agent as the highest-Win-Rate survivor for that ticker. Optimized on In-Sample data, validated on Out-of-Sample data.
- Step 03
Execute & profit
Enter on BUY, exit on SELL. Hold until the signal changes. Open the full transparent trade ledger to see every historical entry, exit, and net return — no black boxes.
No black boxes. Full transparency.
See every historical trade, exact dates, and returns. We show you the Out-of-Sample Win Rate and Profit Factor before you ever enter a trade — and every return is computed with a fully disclosed methodology: next-day open execution, 1.2% round-trip costs, and daily mark-to-market valuation. No black boxes, no curve-fit math.
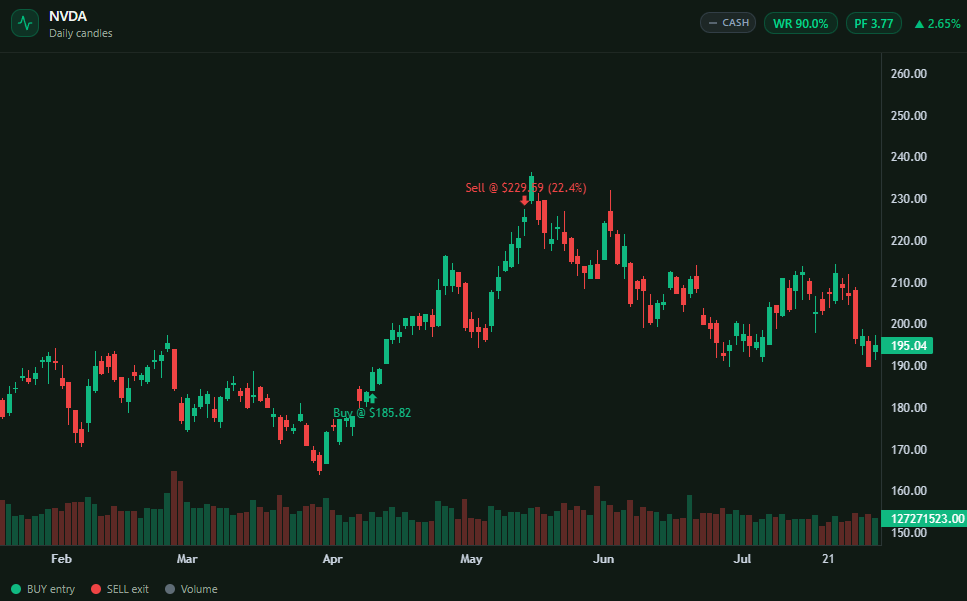
Last 6 closed trades · Break Hunter
Every BUY / SELL plotted on the chart — the same data the ledger is built from.
The same methodology powers every number on this page and in the app. No hidden assumptions, no optimistic shortcuts.
Next-day open execution
Signals generated at close are filled at the next trading day's open price. No look-ahead bias — you could have actually traded these fills in the real market.
1.2% round-trip cost
0.5% commission + 0.1% slippage per side (buy and sell) = 1.2% deducted from every closed trade. Open positions still held at end of data pay only the 0.6% entry-side cost.
Mark-to-market valuation
Equity is marked-to-market daily using each open position's candle close. Drawdowns reflect unrealized losses during holding periods — not just realized losses on trade-close days. This is the honest way to display a portfolio equity curve.
3% sizing, 30-position cap
3% of portfolio equity per position. Maximum 30 concurrent positions (90% total exposure, no leverage). When more than 30 positions are open, per-position size scales down proportionally.
Anti-curve-fit protocol
Per ticker, before aggregation: Out-of-Sample Profit Factor ≥ 1.5 AND IS-to-OOS Win-Rate degradation ≤ 15 percentage points. Only qualified tickers are included in aggregate metrics.
Real production data
Production uses Marketstack (stocks/ETFs, split-adjusted) and Coinbase Exchange (crypto). Sandbox falls back to deterministic synthetic OHLCV, clearly disclosed via a "Demo Data" badge.
These rules are applied uniformly across every ticker, every strategy, and every backtest. Aggregate metrics on the dashboard include only tickers that passed the anti-curve-fit protocol — unqualified tickers are excluded, never averaged in.
13 proprietary strategies. One quant brain picking the best fit.
The agent dynamically picks the best-fitting strategy per ticker — not a one-size-fits-all bot. Every strategy is tested & OOS-validated across five families before it ever touches your watchlist. To qualify, each ticker must clear our anti-curve-fit protocol: Out-of-Sample Profit Factor ≥ 1.5 and IS-to-OOS Win-Rate degradation ≤ 15 percentage points. Unqualified tickers simply don't appear as signals.
Rides sustained directional moves with a trailing exit that adapts to volatility.
Best on long-duration secular trends.
Fades stretched short-term extremes back toward fair value.
Best on range-bound stocks with stable fundamentals.
Catches explosive moves when price breaks out of a defined range.
Best on trending large-caps and high-volatility setups.
Locks onto the slope of a sustained trend and stays with it until the slope breaks.
Best on long-duration secular trends.
Combines quality filters with trend confirmation for higher-conviction holds.
Best on quality compounders held position-term.
Snaps back to fair value after statistically extreme dislocations from the mean.
Best on noisy, regime-shifting universes.
Enters when price is pulled below fair value and exits as it reverts.
Best on range-bound stocks with stable fundamentals.
Fires on expansion after a period of compressed volatility.
Best on trending large-caps and high-volatility setups.
Captures sharp rebounds from deep short-term oversold conditions.
Best on range-bound stocks with stable fundamentals.
Trails price with an adaptive stop that respects trend health.
Best on long-duration secular trends.
Launches on breakouts that follow a tight consolidation phase.
Best on trending large-caps and high-volatility setups.
Reverses at statistically extreme readings using raw high/low structure.
Best on range-bound stocks with stable fundamentals.
Rides trends with a trailing stop hung from the highest peak since entry.
Best on long-duration secular trends.
Latest Signals, As They Happen
Watch BUY and SELL signals trigger in real time across 348+ tickers including US stocks, ETFs, and top cryptocurrencies (BTC, ETH, SOL) — validated end-of-day after market close. Every signal is backed by an OOS-validated strategy with full transparency.
End-of-day signals
Signals are generated after market close each day, then filled at the next trading day's open — no look-ahead bias, no intra-day noise.
Every signal, every stock
Stream all BUY/SELL flips, or filter to just your watchlist.
Full context
Each signal shows OOS Win Rate, Profit Factor, and the validated strategy behind it.
Signals are generated end-of-day and executed at the next trading day's open. Returns account for a 1.2% round-trip cost (commission + slippage) and are marked-to-market daily — see the Performance page for the full methodology.
Practice with $100K Virtual Capital
Test your conviction on Daloop signals without risking a dime. Paper trade the full universe, track your P&L, and build confidence before committing real capital.
Total Equity
$0
+8.4%
Win Rate
0%
4 of 6 trades
Sharpe Ratio
0.00
Good
Max Drawdown
0.0%
Within tolerance
Equity Curve · 30d
+$8,420
Open Holdings
$100,000 virtual cash
Start with a full paper portfolio. No deposits, no risk.
Buy & sell any stock
Trade every qualified stock at live engine prices.
Full analytics suite
Sharpe ratio, max drawdown, win rate, risk/reward — hedge-fund grade metrics.
Follow signals in 1 click
See a BUY signal? Pre-fill the order ticket and execute on paper instantly.
7-day free trial · Trade Like a Quant
Plans that scale with your conviction.
7-day free trial on every plan. Cancel anytime.
Basic
Save $240/yr3 tracked stocks
Billed $588/yr · 7-day free trial, then annual charge.
- 3 tracked stocks
- BUY / SELL signals with OOS Win Rate
- Interactive chart with trade markers
- Full trade ledger transparency
- Daily signal refresh
Pro
Save $600/yr10 tracked stocks
Billed $1188/yr · 7-day free trial, then annual charge.
- 10 tracked stocks
- Everything in Basic
- AI signal narrative
- Market scanner with advanced filters
- Priority daily signal refresh
- Anti-curve-fit verification badge
Premium
Save $1200/yrUnlimited stocks
Billed $2388/yr · 7-day free trial, then annual charge.
- Unlimited tracked stocks
- Everything in Pro
- Full strategy library transparency
- Early access to new strategy families
- Exportable trade ledgers (CSV)
All plans include the Anti-Curve-Fit verification badge and full trade ledger transparency.
Straight answers, no marketing fog.
Ready to trade with conviction?
Join traders who stopped guessing and started following OOS-validated BUY / SELL signals. 7 days free. Trade Like a Quant.
- Trade Like a Quant
- Anti-curve-fit verified